Cash flow, capex, opex, fiscal regimes, NPV, IRR and break-even price, explained with a worked example.
Based on a guest lecture by Rocky de Tomo, a physicist and Shell veteran (1981 onward), given to petroleum geology students.
Abstract. Every oil project is, in the end, a cash-flow problem. This article walks through how cash moves in and out of a project, why capex and opex are taxed differently, how the two big contract types (royalty-tax and production sharing) split a barrel, and how discounting turns a hopeful profit into a defensible one. A single worked example carries through: 300 million of capital, and a net present value that shrinks from 235 million to 25 million as the discount rate rises.
Why economics matters before you drill
The speaker opened with a piece of career advice worth repeating: solid technical training in geology, physics and engineering keeps you employable through every industry downturn. Titles come and go. Skills carry you through the lean years.
He also set expectations. The economics used in classroom exercises are simplified, but the vocabulary is the real thing. When a colleague says “the payout is three years at seven percent,” you should know what that means and where the number came from.
1. Cash flow: the only thing that decides profit
Cash flow is the money entering and leaving a project at each point in time. At any moment a project may be in the hole or in the black. What defines profit is the net position at the end of the project’s life.
Cash in comes mostly from selling oil and gas, but also from selling services to partners, tariffs, loans (common early, because start-up costs are huge) and salvage at the end. Cash out covers capex, opex, royalties and taxes, interest and loan repayments, and decommissioning, which is easy to forget and expensive to ignore.
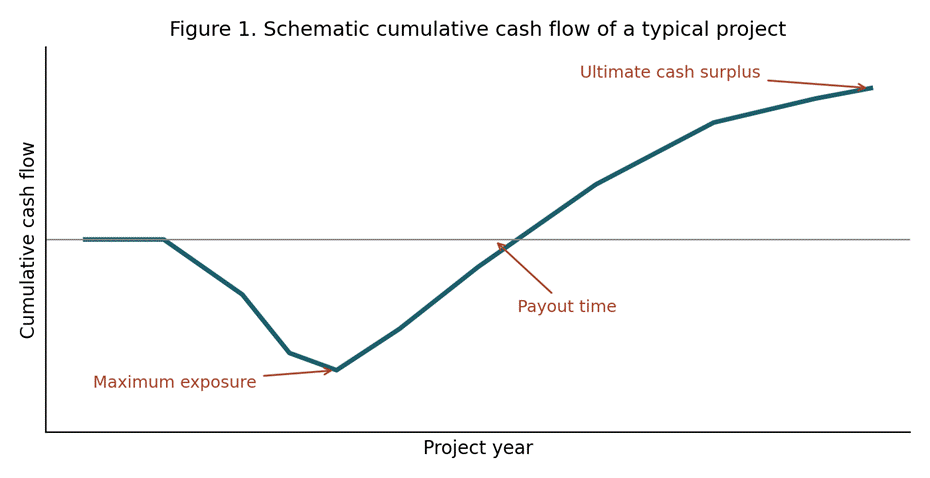
Figure 1. Schematic cumulative cash flow of a typical project (illustrative shape, not real data).
Before sanctioning a project, teams try to predict four things from this curve: the ultimate cash surplus, the maximum exposure (the deepest the project ever digs you in), the payout time (when the curve crosses zero), and the date of first oil.
2. Capex versus opex
Capex is spending that creates a capital asset, adds capacity and serves the project for more than a year: wells, pipelines, platforms. Drilling is so large a share that drillex is often tracked separately. Opex covers operating and maintaining what already exists, and it is mostly consumable.
The boundary is genuinely fuzzy. Clean out a well that has stopped flowing and it is opex, because nothing new was created. Drill a new well with the same rig and it is capex. The classic argument is seismic: shot for long-term field development it can be argued as capex, shot to place one sidetrack it looks like opex. Partners argue about this, and a national oil company and an independent may prefer different answers.
Estimating opex early in a project
Three common methods: by activity (a platform with five people costs a known amount per year), as a percentage of capex (usually 2 to 5 percent), or per unit of production (for example 50 cents a barrel or per mcf).
Why the label matters for tax
Opex is deducted from income immediately, so it is untaxed. Capex cannot be deducted directly. It is depreciated over several years, and only against revenue that is actually there. Governments do not send a cheque for unused deductions. Intangible items such as drilling mud are treated as expenses rather than capital, which is one reason water-based versus oil-based mud choices show up in cost discussions.
3. Depreciation and a worked example
Depreciation spreads an asset’s cost over its useful life, like writing off a refrigerator over ten years. The faster an asset can be depreciated, the lower the early tax bills and the better the early cash flow. Companies also use it in their books, where it feeds return on capital employed (ROCE):
ROCE = EBIT ÷ capital employed
Example from the lecture: EBIT fell from 100 million (2018) to 85 million (2019), yet ROCE rose from 40 to 45 percent, because assets fell faster than earnings. Falling earnings are normal for a producing asset since production declines.
Now the worked project example. Capital of 300 million is spent up front (100 million, then 200 million). Opex is 5 percent of capex, or about 15 million a year. Depreciation runs straight-line over five years, 60 million a year, starting once revenue begins. Tax is 40 percent.
| Line (first producing year) | $ million |
| Revenue | 200 |
| Less opex | −15 |
| Less depreciation | −60 |
| Taxable income | 125 |
| Tax at 40% | 50 |
Table 1. First producing year of the worked example.
4. Who owns the oil, and how a barrel is split
Only onshore United States and Canadian provinces such as Alberta let individuals or companies own subsurface minerals. Everywhere else the government owns them, and it sets the fiscal regime: signature bonuses, rentals, royalties, income taxes and sometimes special levies nobody planned for. That difference explains why fracking took off in Texas and not in France — a Texas landowner gets a share of the profits, a French farmer gets surface rent at best.
Royalty-tax concession
Used in the US Gulf of Mexico and the North Sea. The company builds and owns the facilities and recovers capex through depreciation. The royalty always comes off the top, profit or no profit, in cash or in kind. The weakness is for the government: large depreciation and opex can consume nearly all revenue in the early years, leaving almost nothing to tax. That made the model unpopular with countries that depend on oil tax income.
Production sharing agreement (PSA)
Common with national oil companies, for example Brazil’s pre-salt. The government owns the facilities and reserves. After royalty, the remaining “equity oil” pays opex and then capex, but capex recovery (“cost oil”) is capped at a percentage, with any excess carried forward. The rest is profit oil, shared with the government partner and then taxed. The government gets a predictable minimum each year; the company faces slower capex recovery, reserves that move with oil price, and heavy documentation, since costs must be agreed and proven, and unrecovered costs lose value with every year of delay.
| Step | Royalty-tax (Gulf of Mexico) | PSA (30% cost ceiling) |
| Royalty off the top | 20% | 20% |
| Left after royalty | 0.80 | 0.80 |
| Early years | Profit and tax near zero | At least 50% always taxable at 35% |
| Company profit (NOC 50/50 partner) | 20–50% of revenue later | About 16%, up to 24% later |
Table 2. Illustrative share of a barrel under each contract type, from the lecture.
Government take
Before 2000, worldwide government take averaged under 10 dollars per barrel of oil equivalent. Between 2000 and 2014 it rose to over 30 dollars. By country it varies enormously — figures cited in the lecture were roughly 30 percent for Mexico, up to about 80 for Egypt, and up to about 90 for Venezuela; these should be checked against a current source before publishing. The speaker’s own observation: fiscal terms tend to be tougher where the basin is more attractive. In one Libyan bid round, companies bid on how much of future revenue to give the government, and the winner reportedly offered roughly 99 percent.
5. The time value of money
Money of the day (nominal) is what is actually paid at the time. Real terms money is fixed to the purchasing power of one reference date. A 10 percent pay rise in a year of 10 percent inflation leaves someone unchanged in real terms. A 20 million well today costs far more in nominal terms six years out, even at modest inflation.
The guiding rule: accelerate income, defer spending. Would you take 900 dollars now or 1,000 dollars in a year? It depends on the discount rate.
| Discount rate | In 1 year | In 2 years | Beats 900 today? |
| 5% | 952 | 907 | Yes, both |
| 10% | 909 | 826 | Year 1 only |
Table 3. Present value of 1,000 dollars received later.
The same logic explains phased development: spending 100 million in one year has a present value of 100, while splitting it into smaller amounts over later years reduces the present value — the lecture cited figures in the 75 to 84 million range for two different phasing patterns (worth re-checking against the original slide before publishing). Real projects can take a long time; the speaker mentioned one that needed 15 years between sanction and first production. Many operators build a small platform, drill enough wells to fill it, and add wells as decline sets in, funding later investment from earlier income.
A note from a fellow panelist in the lecture: the US Securities and Exchange Commission standard for reserves uses a 10 percent discount rate (NPV10), even though the cost of money today is lower, and some companies now screen at 7 or even 5 percent.
6. The metrics investors ask for
Net present value (NPV) is the discounted cash surplus. In the worked example it was 235 million at zero discount, about 100 million at 7 percent, and about 25 million at 15 percent.
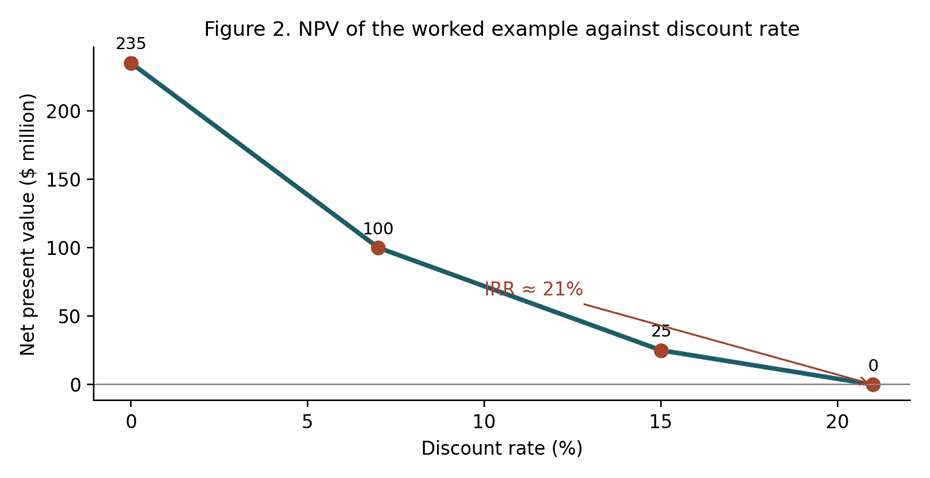
Figure 2. NPV of the worked example against discount rate. Where the curve reaches zero is the internal rate of return.
| Metric | What it tells you |
| Ultimate cash surplus | Net cash at project end, zero discount |
| Maximum exposure | Deepest point of cumulative cash |
| Payout time | When cumulative discounted cash turns positive |
| Profitability index | NPV ÷ PV of capex; ranks projects when capital is limited (0.47 in the example) |
| Unit technical cost | PV of capex + opex ÷ PV of production; useful when production is the constraint |
| Internal rate of return | Discount rate at which NPV = 0 (about 21%) |
| Earning power | Taxable income ÷ value; signals when to sell or abandon |
| Break-even price | Oil price that makes discounted NPV zero (32.35 dollars at 7%) |
Table 4. Key terms at a glance.
A rule stressed in the lecture: when ranking projects, divide what you want by whatever resource is the constraint. Limited capital points to the profitability index; limited production points to unit technical cost. Companies also weigh metrics differently — some favour NPV, others rate of return. And the best financial project is not always chosen; a marginal project may still win if it opens a new country or proves a technology.
Screening prices and sensitivities
Nobody can predict oil prices reliably (“if you can, you are in the wrong business”). Teams test against low, likely and high screening prices — 45, 57 and 65 dollars per barrel in the lecture example — and companies keep their real screening values confidential. Crude quality is also adjusted for: at the time of the talk, roughly one dollar per barrel per API gravity point, plus transport differentials. Investors typically also ask for P10, P50 and P90 volumes, the effect of a one- or two-year delay, and sensitivities, often shown as spider or tornado charts.
Key takeaways
- Profit is the net cash position at the end, but discounted cash is what actually drives the decision.
- Capex is depreciated; opex is deducted immediately. How a cost is classified changes the tax bill.
- Royalty-tax and production sharing contracts split the same barrel very differently, and the government usually takes the larger share.
- Always state the discount rate. NPV without one is meaningless.
- Defer spending, accelerate income, and test every project against price, volume and delay.
Figures are taken from an educational lecture and are illustrative, not investment advice. Speaker name, spelling and the numbers marked above for re-checking should be verified against the original recording before publishing.