Modern well planning software will happily crunch every number in a directional well plan for you. And yet, walk onto almost any rig with an active directional job, and you’ll still find a directional hand doing math on paper between surveys. That’s not old-fashioned stubbornness — it’s because the numbers on that piece of paper, called a slide sheet, are what actually tells the driller which way to steer right now, and waiting on the computer in the doghouse isn’t always fast enough.
This post covers the core hand-calculations every directional driller learns early: build-up rate, dogleg severity, and the slide sheet that ties it all together — plus a strange-sounding tool called the Ouija board that’s been quietly doing this math since long before computers were an option.
Build-Up Rate: The Speed of the Curve
We touched on Build-Up Rate (BUR) briefly in the well profiles post, but it’s worth slowing down on. BUR simply describes how quickly inclination is increasing, standardized to a common unit so wells can be compared apples-to-apples:
BUR = (Change in Inclination) ÷ (Course Length in metres) × 30
In plain English: how many degrees would this well build if it kept curving at the current rate for 30 metres.
Where this gets genuinely useful is that BUR converts directly into a radius of curvature — literally treating the curving wellbore like an arc of a circle:
Radius (m) = 1718.89 ÷ BUR (°/30m)
That constant isn’t arbitrary — it falls out of the geometry of converting an arc-length formula into “degrees per 30 metres” units. But the practical takeaway is simple: the higher the BUR, the smaller the radius, the tighter the curve.
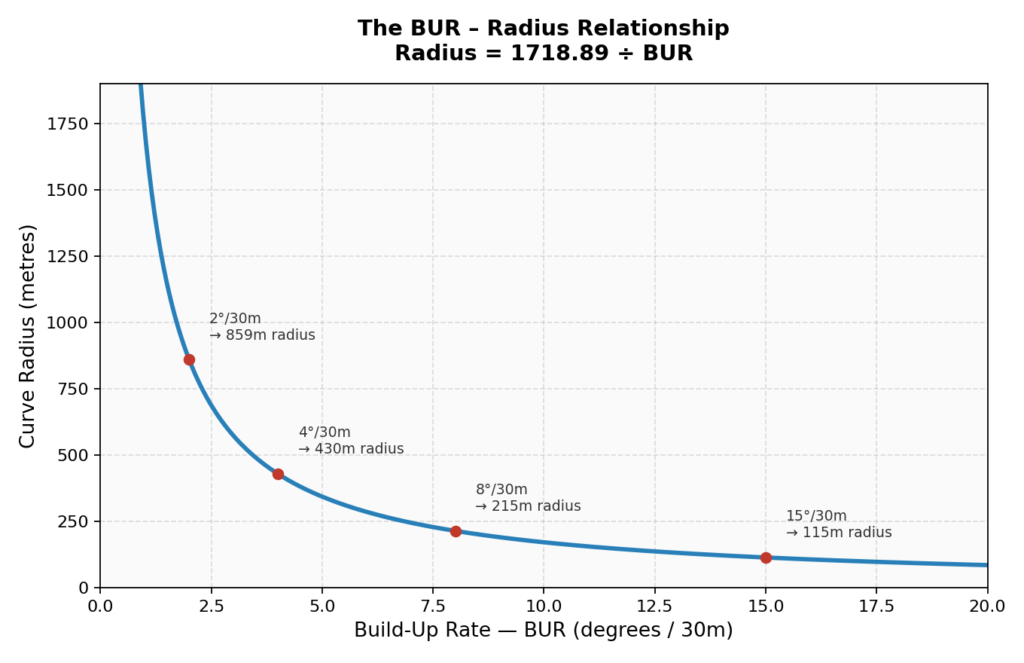
This single relationship is the seed for almost every downstream calculation in well planning — TVD, horizontal displacement, and measured depth between two survey points can all be derived once you know the radius the well is curving on.
Dogleg Severity: Why Everyone Watches This Number
If BUR describes the vertical curve, Dogleg Severity (DLS) describes the total curvature of the wellbore — combining any change in inclination and any change in azimuth into one number, again standardized to degrees per 30 metres.
Why does this get its own name and its own obsessive attention on the rig floor? Because a wellbore isn’t just a mathematical curve — it’s a hole that solid steel pipe has to physically bend through, over and over, every time a new drill string is run in or pulled out. A high dogleg severity means:
- More fatigue stress on the drill pipe and connections every time it rotates through the curve
- A higher chance of a stuck pipe, key-seating, or a washed-out connection
- Real limits on which tools can even physically pass through — an aggressive motor bend, a long fixed-cutter bit, or a rigid MWD tool might simply not survive a severe dogleg
That’s why every well plan defines a maximum allowable dogleg up front, as one of the restraints the client and the directional driller both agree to respect. Here’s roughly how that risk scales:
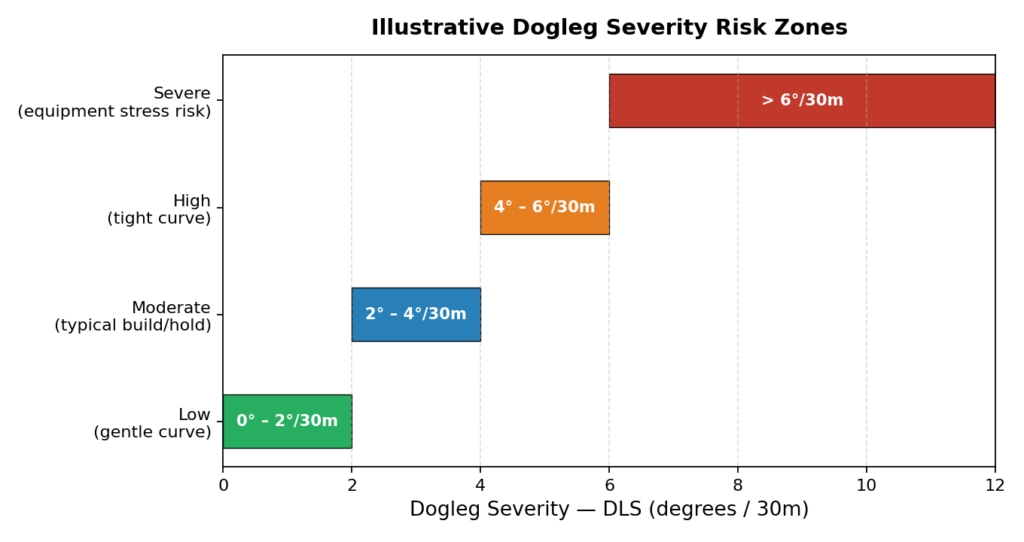
(These bands are illustrative — actual limits depend on the specific BHA, tubulars, and connections being run, and get set case by case.)
The Slide Sheet: Doing It Live, Between Surveys
Here’s the practical problem the slide sheet solves: a directional hand gets a survey every so often (say, every 30-90 metres), but drilling doesn’t stop and wait in between. So how do you know, in the meantime, whether you’re still on track to hit the target?
The slide sheet is a running, hand-updated table that tracks exactly that. At minimum it needs:
- A tie-in point — the last confirmed MD, inclination, azimuth, TVD, and coordinates
- The surface location or KOP in local coordinates
- The target location, with its elevation reference
- The bit-to-survey distance — because the survey sensor isn’t sitting at the bit, it’s a known distance behind it
From there, every new survey gets run through the same sequence of calculations: course length, BUR, TVD, horizontal displacement, and dogleg severity — the same math from the sections above, just applied point-by-point as the well progresses.
Here’s a simplified version of what that looks like on paper:
| MD (m) | Inc (°) | Az (°) | Course Length (m) | BUR (°/30m) | TVD (m) | DLS (°/30m) |
|---|---|---|---|---|---|---|
| 400 | 5 | 45 | — | — | 398.5 | — |
| 410 | 7 | 45 | 10 | 6.0 | 408.1 | 6.0 |
| 440 | 9 | 46 | 30 | 2.0 | 437.6 | 2.1 |
| 470 | 12 | 47 | 30 | 3.0 | 466.7 | 3.2 |
The real power move, though, is the second half of the slide sheet: projection. A directional hand doesn’t just record where the well has been — they use the current build trend to project ahead, estimating what the inclination and TVD will look like at the bit right now, and further out at the target itself. That’s what lets someone stay on the rig floor making steering decisions instead of running back to the doghouse every time they need an answer.
The Ouija Board: Old-School, Still Relevant
Before any of this was computerized, directional hands used a physical slide-rule-like device nicknamed the Ouija board to work out steering answers fast. The concept behind it is still exactly what gets used today, computer or not: it assumes the toolface is pointed straight up (the simple case), and lets you solve for build rate, turn, or the actual toolface needed, given the other variables.
The twist is what happens when the toolface isn’t pointed straight up. If you’re holding a toolface off to one side, the amount of build you actually get is reduced by the cosine of that toolface angle — meaning a motor pointed 90° off from “straight up” contributes essentially zero build, and all of its output goes into turning the well instead. That single relationship is what lets a directional hand predict azimuth changes from a slide interval where magnetic interference might otherwise make it impossible to get a clean azimuth reading directly.
Why This Still Matters in a Computerized World
It would be easy to assume all of this manual math is a relic. It isn’t, for a simple reason: the surface computer in the work shack is only as good as the survey data it’s fed, and it isn’t standing on the rig floor watching the weight indicator in real time. The hand calculations are what let a directional driller make an immediate steering call, sanity-check what the software says, and catch a mistake before it turns into a sidetrack nobody wanted.
Coming Up Next
We’ve now covered how a well is planned, how its position gets measured, and how the driller does the math to stay on target between surveys. The next post moves into the hardware that actually does the steering — positive displacement motors (PDMs) and the steerable bottom hole assemblies built around them, including how the adjustable bent housing works and what actually causes a motor to stall.
This is post 3 in an ongoing series on the fundamentals of directional drilling. Post 1 covered well profiles, and post 2 covered how survey tools locate the drill bit downhole — worth a read if you’re just joining in.